Reference+
Name
bezier()
Description
Draws a Bézier curve on the screen. These curves are defined by a series of anchor and control points. The first two parameters specify the first anchor point and the last two parameters specify the other anchor point. The middle parameters specify the control points which define the shape of the curve. The curves were developed by French engineer Pierre Bezier. Using the 3D version requires rendering with P3D (see the Environment reference for more information).
Examples
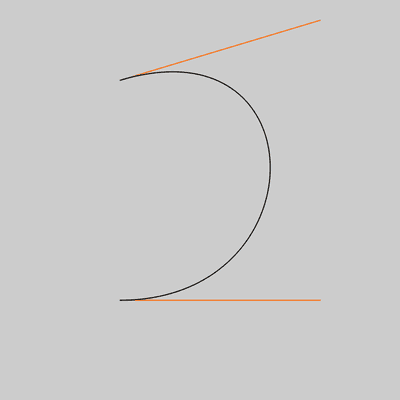
size(400,400); noFill(); stroke(255, 102, 0); line(120, 80, 320, 20); line(320, 300, 120, 300); stroke(0, 0, 0); bezier(120, 80, 320, 20, 320, 300, 120, 300);![Image output for example 1]()
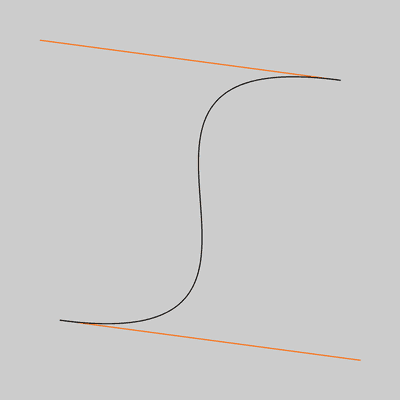
noFill(); stroke(255, 102, 0); line(340, 80, 40, 40); line(360, 360, 60, 320); stroke(0, 0, 0); bezier(340, 80, 40, 40, 360, 360, 60, 320);![Image output for example 2]()
Syntax
bezier(x1, y1, x2, y2, x3, y3, x4, y4)bezier(x1, y1, z1, x2, y2, z2, x3, y3, z3, x4, y4, z4)
Parameters
x1(float)coordinates for the first anchor pointy1(float)coordinates for the first anchor pointz1(float)coordinates for the first anchor pointx2(float)coordinates for the first control pointy2(float)coordinates for the first control pointz2(float)coordinates for the first control pointx3(float)coordinates for the second control pointy3(float)coordinates for the second control pointz3(float)coordinates for the second control pointx4(float)coordinates for the second anchor pointy4(float)coordinates for the second anchor pointz4(float)coordinates for the second anchor point
Return
void
Related

This work is licensed under a Creative Commons Attribution-NonCommercial-ShareAlike 4.0 International License.

